


Increasing efficiency in field service is a vital part of growing your business. Modern field service management has come a long way since the days of clipboards and paper logs. Using data analytics can help you further improve the service you provide to your customers. This is while reducing downtime and using your workforce more effectively. Data analytics can help or how to leverage technology in the most effective way. Using an operational dashboard helps you better track and monitor your workers and ensure that you are continually improving.
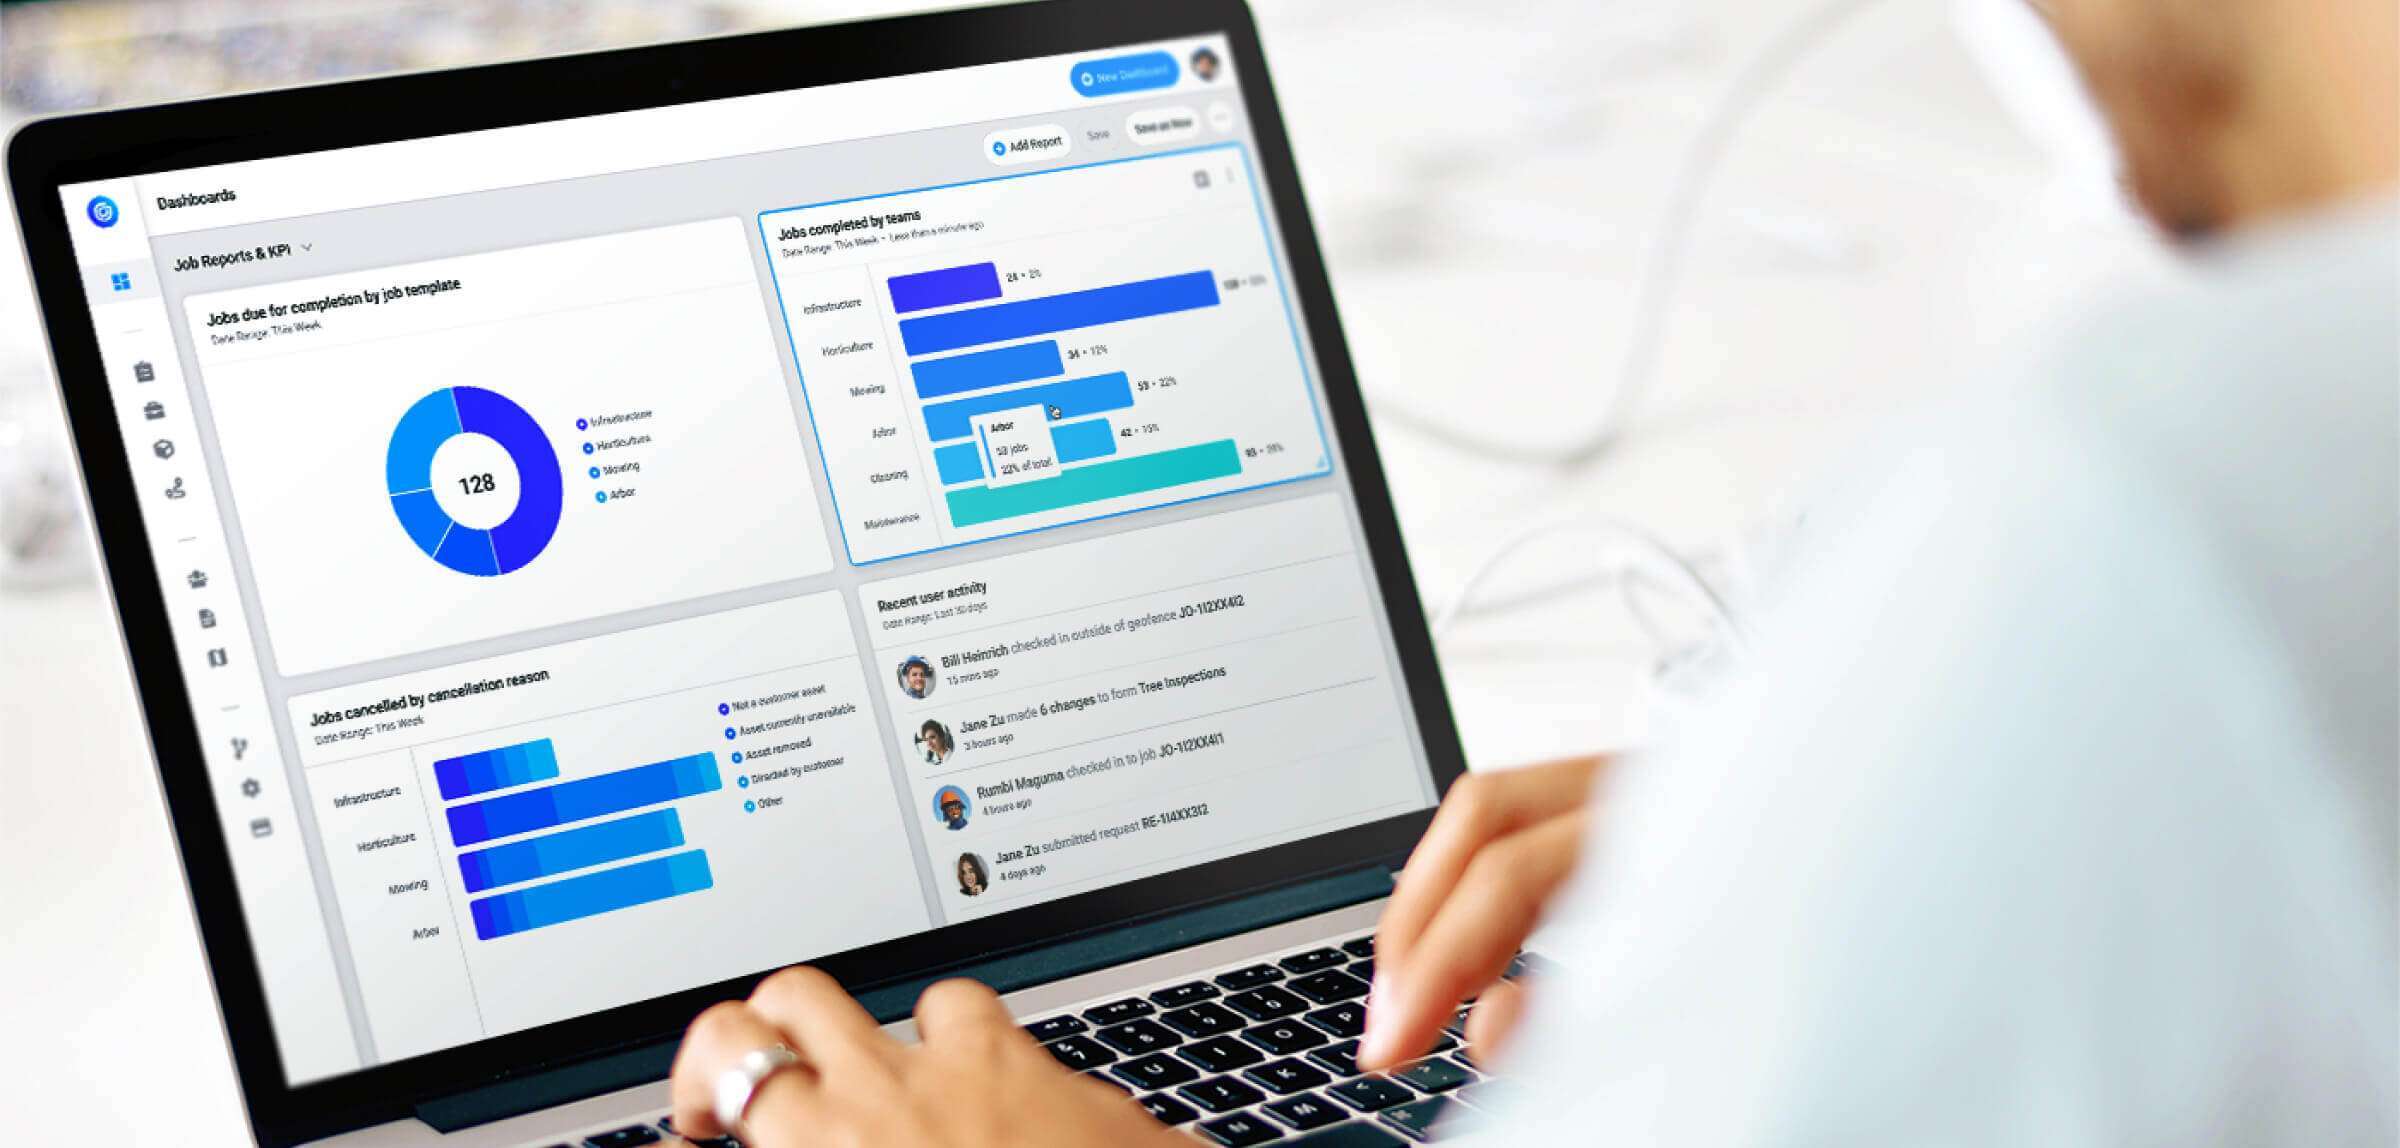
What is an Operational Dashboard?
An operational dashboard is an analytics interface designed for monitoring and managing tasks and workers’ performance with a short time horizon. For example, your operational dashboard might track the average time it takes for a technician to get to a client’s home after being called for both emergency and routine calls.
It might also track how long it takes to do each type of repair. Thus, helping you plan appointments to reduce delays. The operational dashboard provides a window to the data you are obtaining and helps you easily see what is going on.
So, what kind of things should your operational dashboard cover, so as to include the right data analytics?
Assets Under Management
In this context, assets under management refer to your physical assets. This often means tools, equipment, vehicles, etc. While some assets might be assigned to a worker in the long term, others might be “checked out” for a specific job. Keeping track of their location at all times helps ensure that they make it back to where they are supposed to be and that you can plan appointments around their availability.
Assets may also be at a fixed location. For a power company, assets include the substations and power poles. For a local council, the parks, roads, playgrounds, libraries and swimming areas are all part of the asset pool.
Assets Overdue for Servicing
One key piece of data to track is when physical assets need servicing or maintenance. One classic example would be when vehicles need to be brought in for an oil change.
If the asset is a playground, lack of servicing may lead to broken equipment or dangerous rubbish lying around presenting a public danger.
Ensuring your assets have a servicing schedule and that schedule is being met is crucial for good asset management.
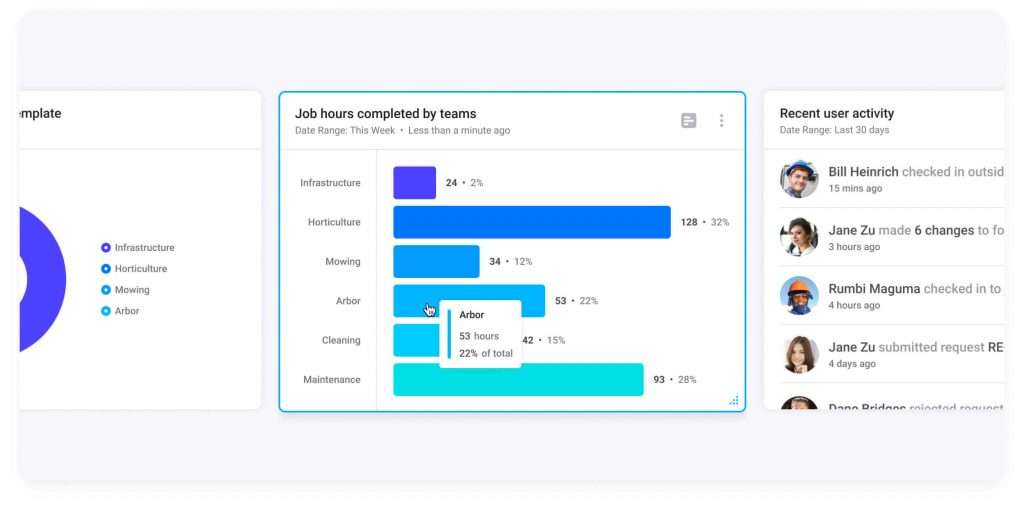
Job Hours Monitoring
It’s vital to know how long specific jobs really take your technicians. Estimates are useful for new technology, such as installing a new type of boiler. However, they are never going to be accurate. You could use data analytics to determine:
- The average time a specific job takes.
- The average time a specific worker or team takes on the job, allowing you to spot performance issues. Potentially, you may also realize that a specific person is faster at some jobs than others and plan assignments accordingly.
- Total amount of time being worked.
- Unallocated time.
- Overallocated time.
This kind of monitoring also helps you establish whether you are planning jobs to minimize travel time. Ideally, you should be sending your technicians on routes that minimize both the time taken and the amount of fuel used. This is not always the shortest route. So using data analytics to monitor actual travel times including the impact of traffic can really help.
Job Cancellation Monitoring
Keeping track of job cancellations and the reasons for them is important. For example, spotting a pattern in what kind of jobs are canceled can tell you something about the information you are providing to customers and whether it is sufficient. A pattern in when jobs are canceled can also give information.
Above all, monitoring job cancellation can tell you how you are doing at a customer service level and where you need to improve. Minimizing cancellations is vital for efficiency.
Jobs Completion Monitoring
Do you know how many of your jobs are completed in on time? Tracking this kind of data can help you correctly direct training efforts as well as keeping track of individual worker performance. The ability to reward employees who consistently complete jobs in a timely manner is important.
Workforce Structure
Your dashboard should also show the structure of your workforce. It should show things such as:
- Team size
- Role allocations
- Employee status
Tracking workforce structure helps you schedule hours better and determine future hiring patterns.
System Resource Monitoring
Finally, it’s important to manage system resources properly. Your field service teams are going to be sending and receiving emails, storing files, sending each other pictures, etc. Monitoring system resources help make sure that you are spending enough on IT to provide your teams with the bandwidth they need, without overspending and wasting money.
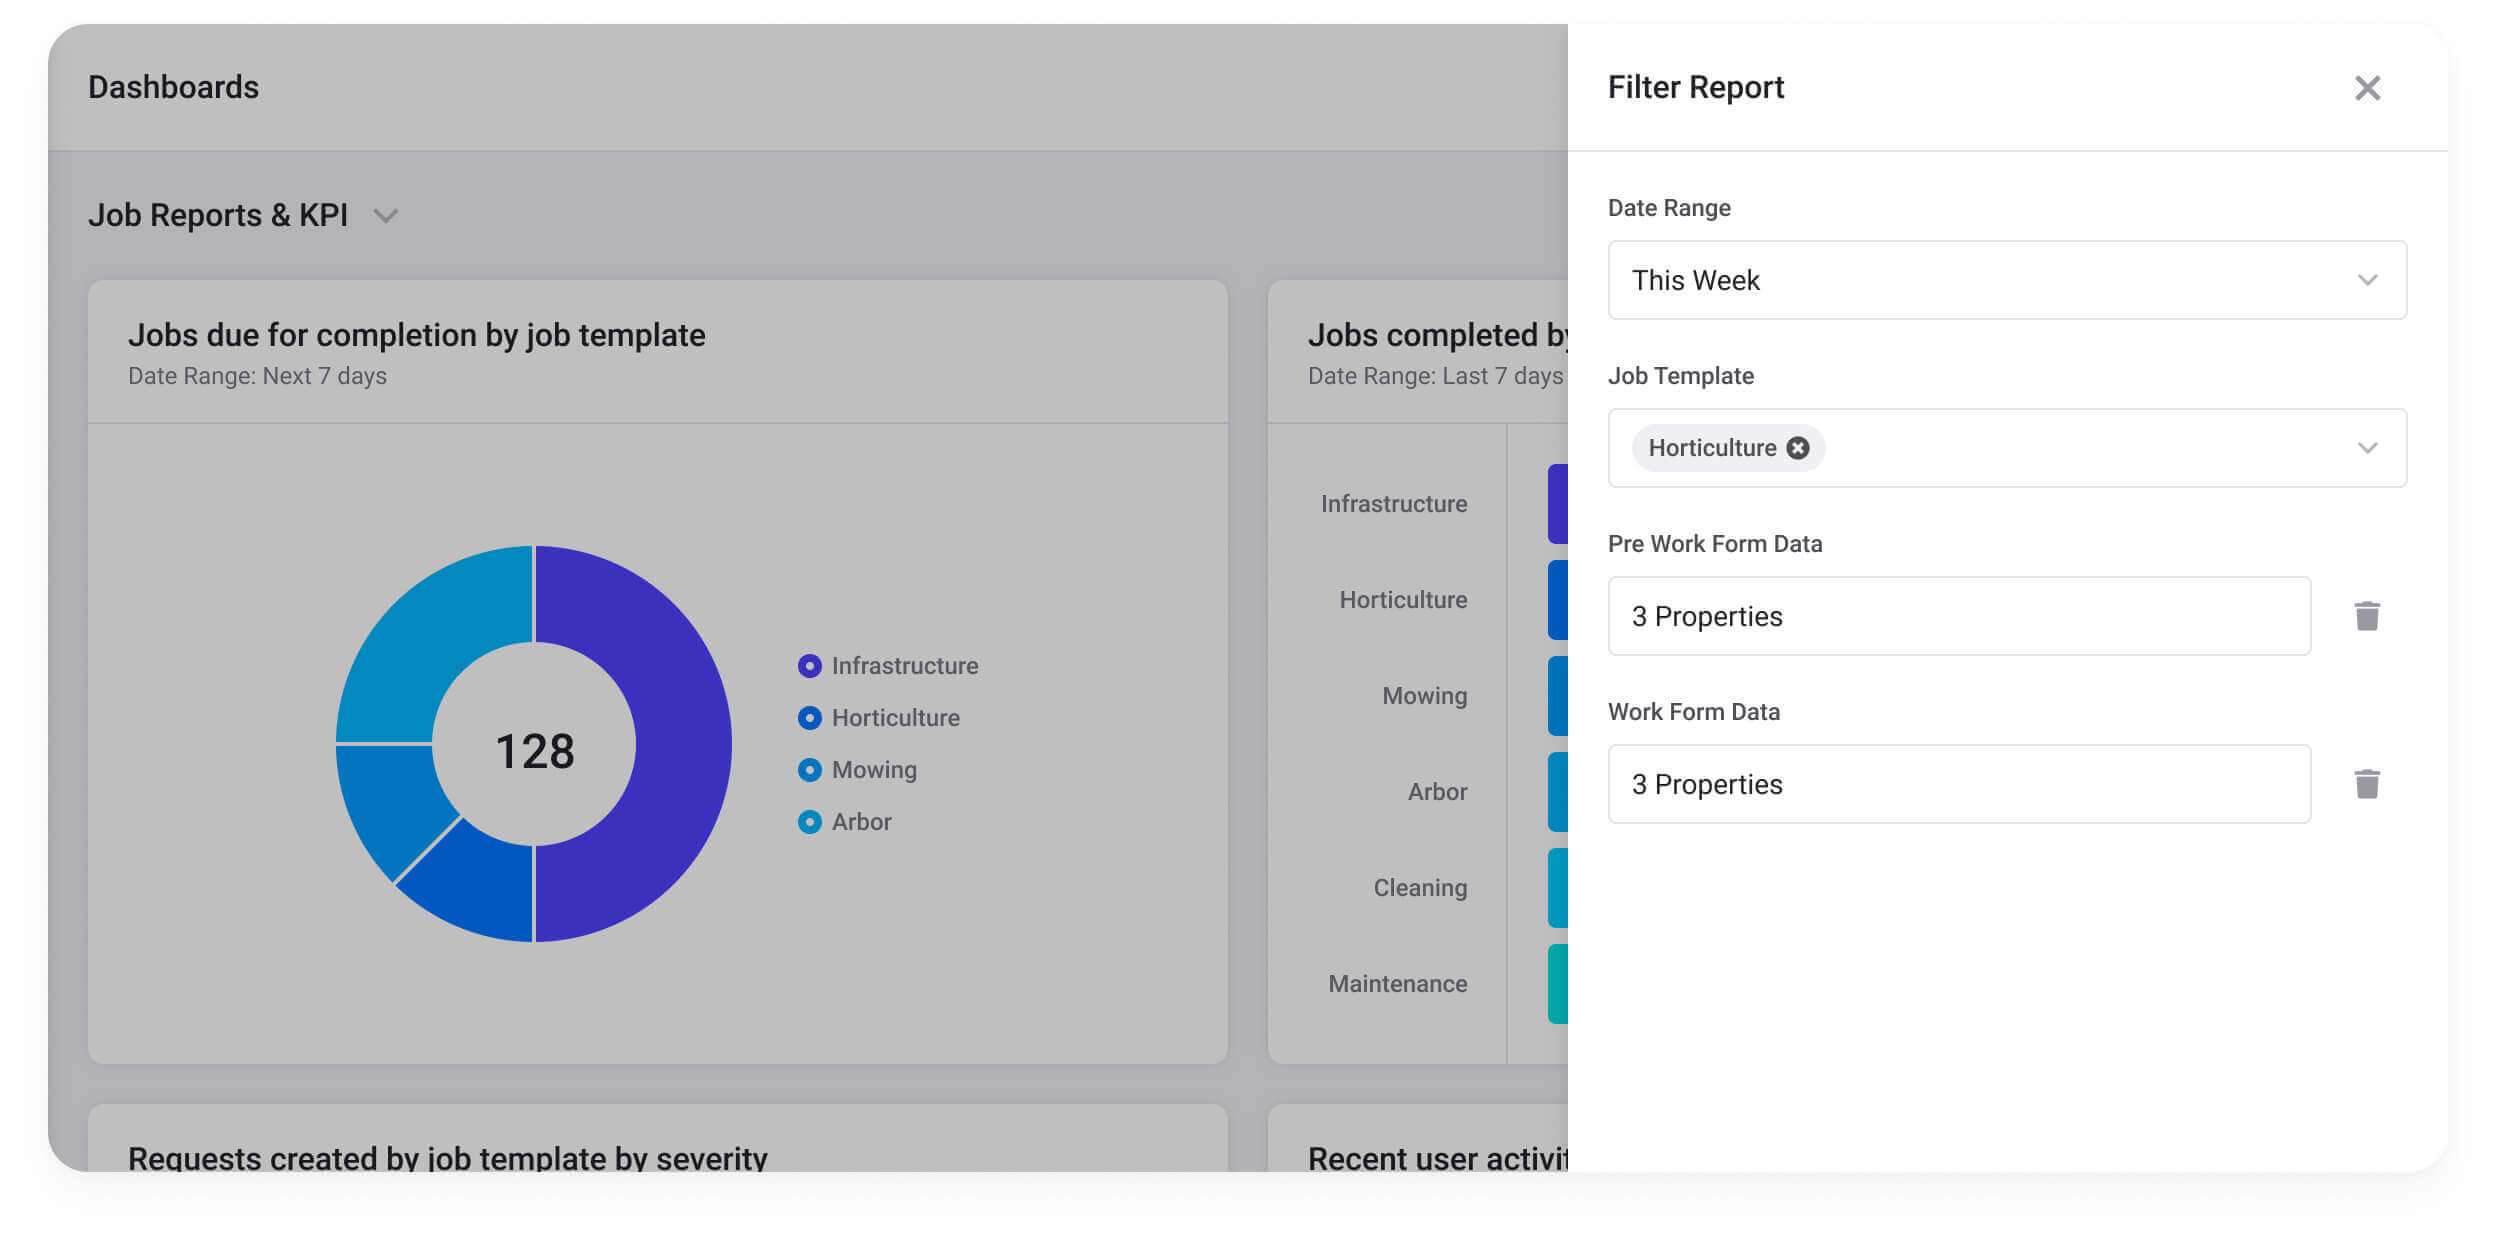
Data Analytics Diving Deeper
The dashboard is the front end. Behind it are your data analytics. It’s vital to monitor the data needed for the dashboard, but also to keep in mind your goals and KPIs. For example, you might have a KPI for reducing transportation costs. This ties into job completion and job hours monitoring. You can reduce transportation costs by sending techs by more efficient routes, tweaking training to reduce return visits, and making sure vehicles are serviced on time.
From that example, you can see that all of the data can wrap into certain KPIs. You might also be wanting to monitor such things as job completion and cancellation ratios, number of return visits, etc. It’s important to engage in data democratization, which brings all of your data sources together and allows everyone to access them. For example, your field technicians themselves need to know how long a given job is likely to take. Looking at the averages will help less experienced personnel give better estimates.
Some data analysis is for a longer term horizon and not appropriate for a dashboard. It requires a deeper understanding of the data and may be unique to your situation. Built in support for open standards for data access and widely available software such as PowerBI will empower your management to develop their own long term management reporting.
All of this means that you need the right system to provide the operational dashboard you need, combined with the ability to delve deeper and analzye the data. The software needs to be flexible enough to ensure that you have what you need and easy enough to customize without coding. This is how Gruntify can help. Contact us today! Find out how our field management software can help you get better data insights and improve the service you give to your customers.